Cumulative measures are perfect for visualizing running totals over time, such as sales or progress toward a goal. Follow these steps to create one:
1️⃣ Create a Measure for Your Total Value
First, create a measure to calculate the total value you want to track cumulatively. For example, to calculate total sales:
Total Sales = SUM('Sales'[SalesAmount])2️⃣ Create a Cumulative Measure
Next, create a cumulative total measure using DAX:
Cumulative Sales =
CALCULATE(
    [Total Sales],
    FILTER(
        ALLSELECTED('Sales'[Date]),
        'Sales'[Date] <= MAX('Sales'[Date])
    )
)
This code sums values up to and including the current date based on the applied filter context.
3️⃣ Visualize Your Cumulative Measure
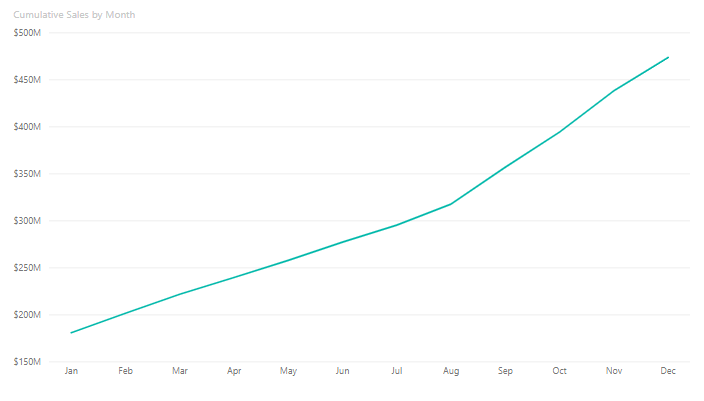
Place your Cumulative Sales measure on a visual such as a line chart along with the date column to see the running total.
🔎 Tips:
- Sorting: Ensure your date column is sorted correctly for accurate results.
- Context Filtering: Use
ALLSELECTEDto respect user-applied filters, or modify it as needed. - Testing: Use slicers to see how your cumulative measure responds dynamically.
Now you’ve created a cumulative measure in Power BI! 🎉
Have you tried this or have a unique use case? Share your experience!